Looking to Sell or Let?
Begin your journey with a free property valuation. Get the facts and figures to make informed decisions.
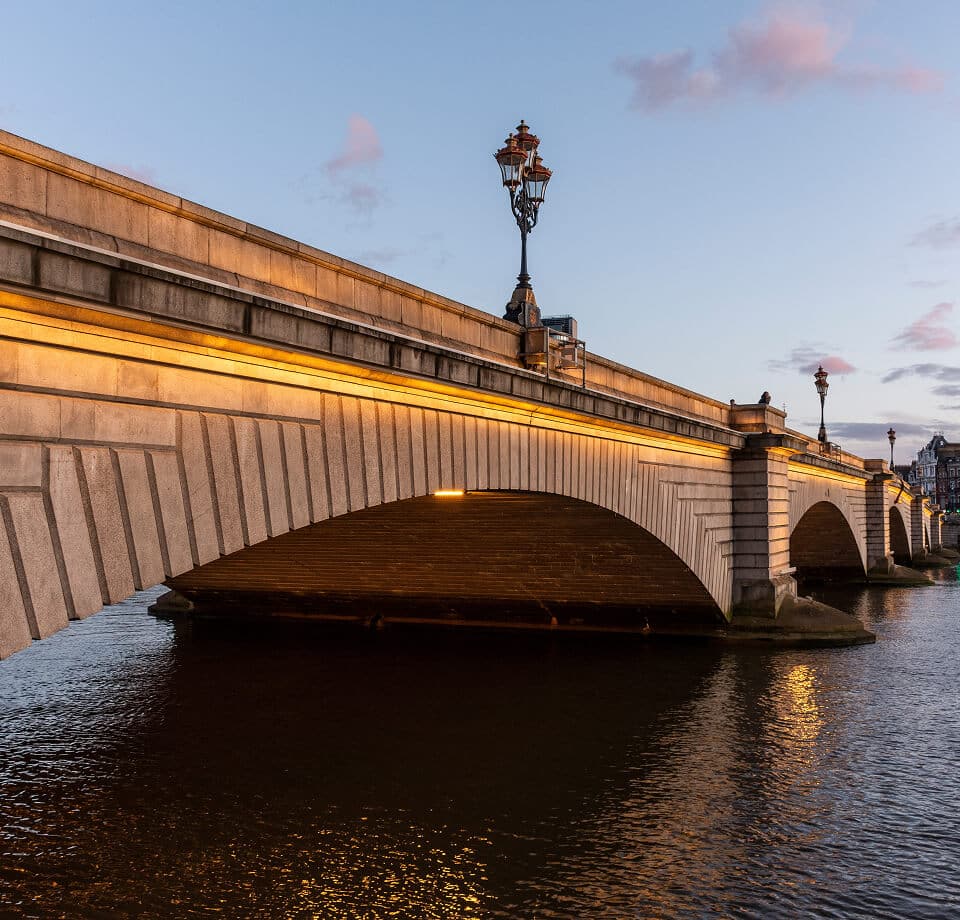
South West London’s property market is pulling in two directions. Sales prices have eased back from their 2022 peaks, and a significant share of listings are sitting longer than sellers would like. At the same time, the rental market is tightening further, with rents rising at their fastest pace outside prime central London and available stock continuing to fall. Whether you’re buying, selling, letting or renting, the picture looks quite different depending on which side of the market you’re on.
The average sold price across the SW postcode area over the past twelve months stands at around £951,000 (Zoopla, 2026), though Rightmove’s figures put the broader South West London average closer to £777,000, down 2% on the previous year and roughly 7% below the 2022 peak of £835,000. The gap between those two figures reflects the wide spread of property types and postcodes within the area, from the most affordable end of SW15 through to the prime streets of SW1X, where average prices reach £6.7m.
Flats are the weakest segment by some distance. More than two thirds of one and two-bedroom flats listed this year remain unsold, and the flat average across the area sits at around £527,000 (Rightmove, 2026). Terraced and semi-detached houses are holding up considerably better: terraced homes are averaging just over £1m, and semi-detached properties around £1.4m.
| Property Type | Average Sold Price (Rightmove) | Average Sold Price (Zoopla) |
|---|---|---|
| Flat | £526,912 | £623,942 |
| Terraced | £1,034,264 | £1,326,731 |
| Semi-detached | £1,411,968 | £1,556,430 |
| Detached | N/A | £2,339,294 |
The divergence between the two sources reflects differences in methodology and the time periods covered, but the direction of travel is consistent: houses are outperforming flats, and the gap is widening.
Brixton recorded the highest number of transactions of any individual area, with 500 sales between May 2025 and February 2026. Clapham recorded 360 sales over the same period and carries the highest typical overall price at around £596,750, with an area average of £836,000. Clapham’s terraced houses traded at a typical £1.175m, while flats at around £500,000 represent the more accessible end.
Several areas are still trading meaningfully below their recent peaks:
Wimbledon and Wandsworth are showing more resilience than flat-heavy postcodes closer to Zone 1, largely because houses make up a larger share of their stock and demand from families moving out of central London remains reasonably steady.
Nearly 47% of all homes listed in April 2026 were withdrawn from the market unsold (Rightmove, 2026), and overvaluing is the primary cause. The average time to find a buyer in January 2026 was 81 days. Sellers who price realistically from the outset are completing; those who test the market at optimistic figures are spending months on the portals before either reducing or withdrawing. If you’re considering selling, an honest, evidence-based valuation at the outset is the single most effective thing you can do to avoid that outcome. Our guide on questions to ask estate agents when selling covers what to look for when choosing who represents you.
The rental side of the market looks quite different. Average rents in South West London have reached around £2,400 per month, up 6% year-on-year (Zoopla, March 2026). That sits above the broader London average of £2,190 per month on new lets, and demand shows no sign of softening. London was the only region in the country where rental demand rose in the four weeks to 31 May 2026, up 6% over that period alone (Zoopla, 2026).
The strongest growth in prime rental values last year came from South West London neighbourhoods rather than central ones. According to Savills, rents for prime properties rose 6.8% in Wandsworth, 6.3% in Putney, and 5.4% in Barnes, against annual growth of just 0.9% for prime central London. Savills attributed this to sustained demand from domestic, needs-based moves: renters who want good transport connections, access to schools and open space, and are prepared to pay for it.
Rental yields are also improving in Sutton and Merton as young professionals look further out from Zone 1, where rents remain more affordable relative to property prices.
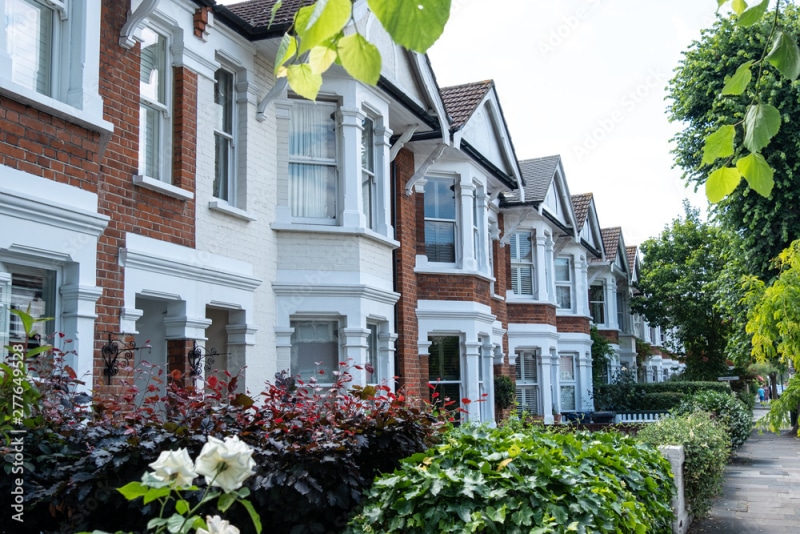
The number of properties available to let in South West London in spring 2026 was 20% lower than at the same point in 2024 (Rightmove, 2026), and overall supply is around 25% below pre-pandemic levels. A proportion of that reduction comes from landlords choosing to sell rather than re-let, put off by rising costs and the regulatory changes brought in by the Renters’ Rights Act. The result is that good-quality properties are letting quickly and at asking rent, while tenants are facing more competition for fewer options.
For landlords weighing up whether to continue letting, it’s worth understanding the full picture before making that decision. Our article on how the Renters’ Rights Act affects the lettings market sets out what has changed and what it means in practice.
Rightmove forecasts UK average asking prices to rise around 2% across 2026 as a whole, which suggests the sales market is unlikely to see sharp movement in either direction. London has recorded negative annual price growth for nine consecutive months at -0.2% (Zoopla, June 2026), and while that figure is modest, it does reflect genuine softness in certain segments, particularly flats and overpriced stock.
On the lettings side, the structural imbalance between supply and demand is unlikely to resolve quickly. Regulatory changes are discouraging some landlords from expanding their portfolios, and new supply is not arriving fast enough to offset departures. For landlords with well-maintained properties in the right locations, conditions remain favourable. For tenants, acting quickly on suitable properties and having references ready in advance will continue to matter.
| Metric | Figure | Source |
|---|---|---|
| SW London average sold price | £777,000 | Rightmove, 2026 |
| SW postcode average sold price | £951,000 | Zoopla, 2026 |
| Most affordable postcode average | £372,000 (SW15 4) | Rightmove, 2026 |
| Most expensive postcode average | £6.7m (SW1X 7) | Rightmove, 2026 |
| Average SW London rent | £2,400 pcm | Zoopla, March 2026 |
| Year-on-year rent increase | 6% | Zoopla, March 2026 |
| Available rental stock vs 2024 | -20% | Rightmove, 2026 |
| Listings withdrawn unsold (April 2026) | 46.7% | Rightmove, 2026 |
If you’re trying to make sense of what these figures mean for your specific property or situation, Chartwell Residential can help. Whether you’re thinking about selling, reviewing your asking price, or deciding whether now is the right time to let, speak to our team for straightforward, local advice. Get in touch with us here.
Begin your journey with a free property valuation. Get the facts and figures to make informed decisions.
Want to discuss something more specific? Contact us, and we will be more than happy to help you.

# Are London Landlords Sleepwalking Into Five-Figure Fines? The rules governing private rentals have shifted dramatically, and self-mana...

## Are You a Wandsworth Landlord? You May Need a Licence — and the Clock Is Ticking Wandsworth Council has rolled out selective licensin...

The UK lettings landscape is set to undergo one of its most significant changes in decades. From 1 May 2026, the Renters’




"*" indicates required fields
"*" indicates required fields